
Short answer: September PCE inflation ran at 3.6% over the past 12 months, the Bureau of Economic Analysis reported. Prices rose 0.5% in September alone. Households spent $113.1 billion more than in August, but after removing price changes, that spending rose by only $2.6 billion.
The table below uses figures from the BEA’s personal income and outlays report for September 2026.
| Measure | September 2026 |
|---|---|
| PCE price index, past 12 months | Up 3.6% |
| PCE price index, September | Up 0.5% |
| Core PCE price index, past 12 months | Up 3.1% |
| Core PCE price index, September | Up 0.3% |
| Personal income, September | Up $54.5 billion, or 0.2% |
| Personal spending, September | Up $113.1 billion, or 0.5% |
| Real spending, September | Up $2.6 billion, or less than 0.1% |
| Personal saving rate | 3.8% |
What the September PCE inflation report shows
The PCE price index is the Federal Reserve’s preferred inflation gauge. It rose 0.5% in September and 3.6% from a year earlier. Core PCE, which strips out food and energy, rose 0.3% on the month and 3.1% on the year. Both readings sit well above where the Fed wants them.
Core September PCE inflation runs lower than the headline figure, which tells you energy is pushing the total up. But a core rate of 3.1% is not a gasoline story alone. Price pressure is also showing up in the rest of the basket.
Income did not keep up. Personal income rose $54.5 billion, or 0.2%. Disposable income, which is what households keep after taxes, rose $52.7 billion, also 0.2%. Prices climbed more than twice as fast as income.
Spending rose, but buying power did not
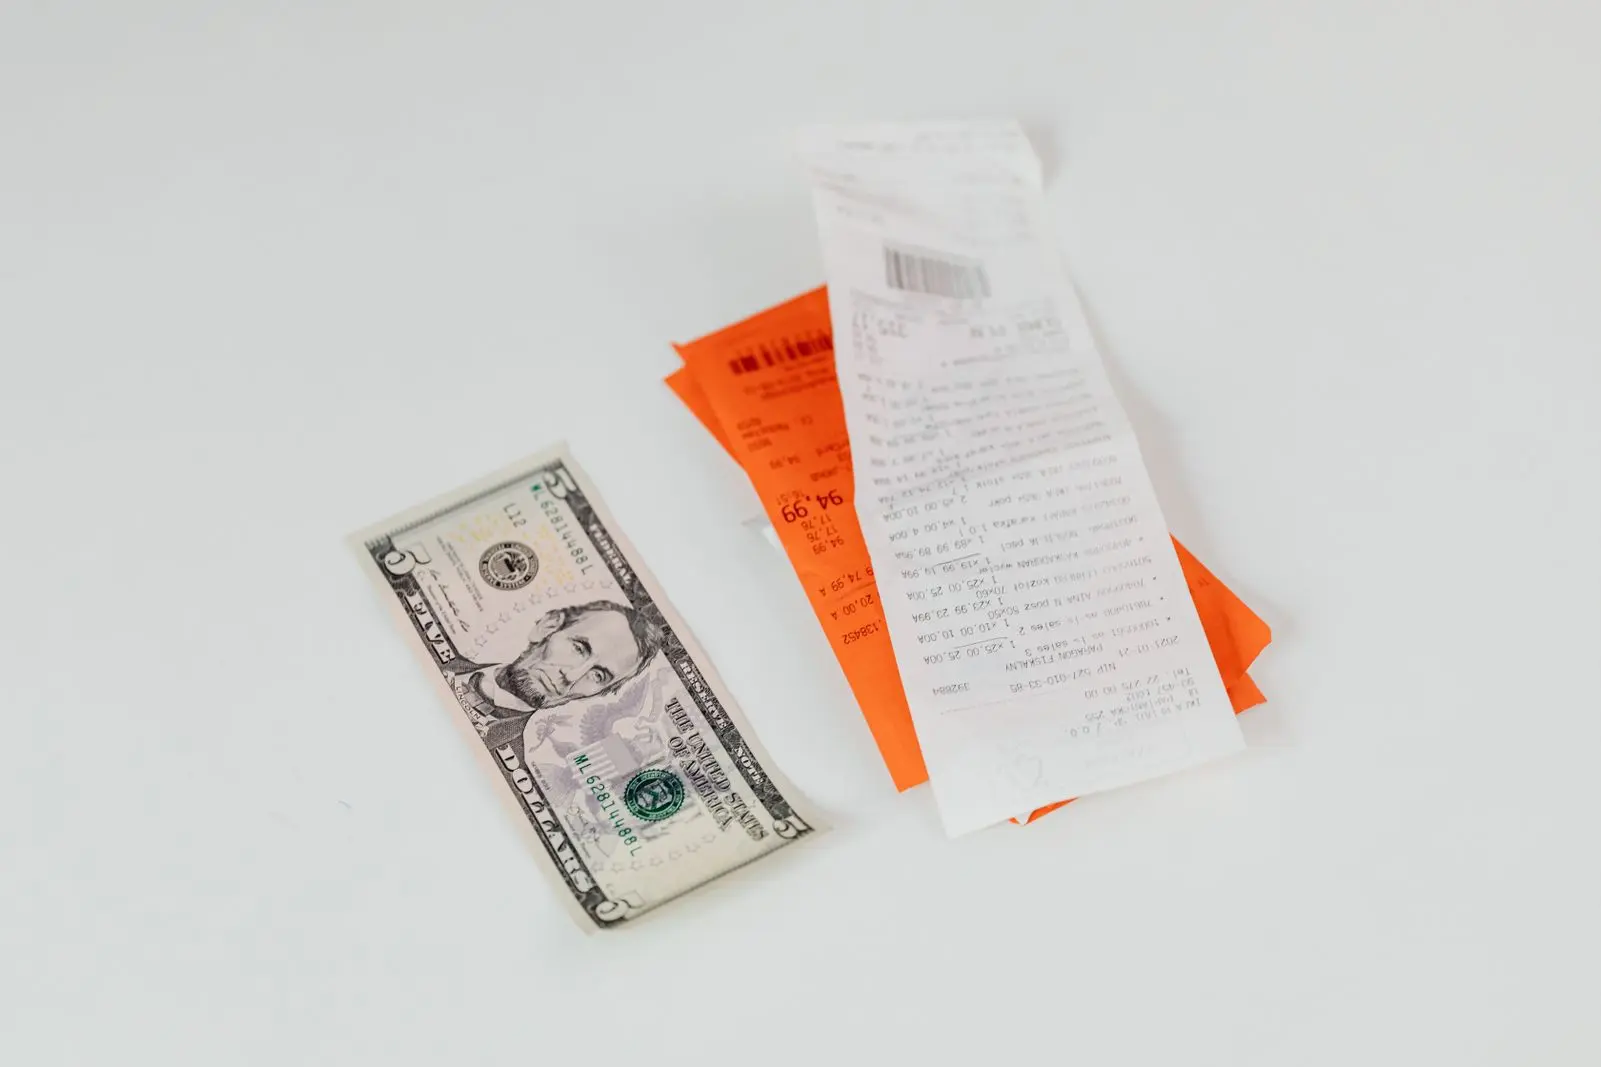
Spending looks healthy until you remove the price effect. Households spent 0.5% more in September. Real spending rose less than 0.1%. In plain terms, almost all of the extra dollars went to higher prices, not to more goods and services.

Energy drives much of the pain. The Labor Department’s September consumer price report showed consumer prices up 3.7% from a year earlier, after a 3.4% rise in August. Energy prices were up 20.4% over 12 months, and gasoline was up 34.2%. Food rose 2.5% and shelter rose 3.2%.
The two gauges measure different baskets and weight them differently. The September PCE inflation reading of 3.6% sits just under the 3.7% consumer price figure. Both point the same way, and neither is close to a calm reading.
A thin cushion for households
The personal saving rate was 3.8%, or $911.1 billion. Spending grew more than twice as fast as income in September. A saving rate that low leaves little room if that pattern continues.
Why the Fed cannot ignore the numbers
The Fed held its target range at 3.75% to 4% on Wednesday. The vote was 10 to 2. Governor Lisa Cook and Cleveland Fed President Beth Hammack voted for a quarter-point increase, according to the Fed’s statement. The statement says inflation remains elevated. Thursday’s September PCE inflation report backs that up.
The same morning, the BEA’s GDP estimate for the third quarter showed the economy growing at a 3.4% annual rate, up from 2.2% in the second quarter. Strong growth plus 3.6% inflation is the mix that gives the two dissenters their argument.
Long-term rates already reflect the worry. The 10-year Treasury yield closed at 5.05% on Wednesday, up from 4.99% the day before, Treasury data shows. Our explainer on the Fed hold covers what that means for savings, credit cards, and mortgages. Our look at Treasury yields before the Fed meeting shows where the bond market stood a day earlier.
Editor’s take
Watch real spending, not the dollar total. A 0.5% jump in spending sounds like confidence, but September PCE inflation turned it into almost no real gain. Officials who describe the economy as strong are looking at output. Families are looking at receipts. If prices keep outrunning income, the number to watch next is the saving rate.