

Figures as of Oct. 21, 2026: the Energy Information Administration’s weekly gasoline price for Oct. 19 and its Brent crude spot price for Oct. 20, the latest available.
Gas prices are still above $4 a gallon, but they have started to ease as crude oil comes off its October high. The U.S. average for regular gasoline was $4.284 a gallon on Oct. 19, according to the Energy Information Administration’s weekly Gasoline and Diesel Fuel Update. Brent crude, the global oil benchmark, was $115.22 a barrel on Oct. 20 in EIA’s daily Brent spot price series, down from $135.51 on Oct. 2. Here is how the two connect, what a fill-up costs, how far apart regions are and what EIA expects next.
Looking for this week’s number for your state? Our U.S. gas prices tracker lists the latest EIA prices by state and region and is updated every week. This article explains what is behind them.
Gas prices now: the EIA numbers
EIA’s Oct. 19 reading of $4.284 a gallon was 4.7 cents lower than a week earlier ($4.331) and 7 cents below Oct. 5 ($4.354). A year earlier, in the week of Oct. 20, 2025, the average was $3.019. That puts gas about $1.27 a gallon higher than last October, a rise of roughly 42% by our math.
The weekly series shows how long prices have stayed high. Every weekly reading since July 20 has been above $4. The highest of 2026 so far was $4.500 on May 11, and the September peak was $4.478 on Sept. 21. Since then the average has slipped about 19 cents.
What gas prices cost a household

Try a rough example. We’re assuming a 15-gallon fill-up, which is our own illustration. At $4.284 a gallon, that fill-up costs about $64.26. At last year’s $3.019, the same tank cost about $45.29. The difference is about $19 every time you fill up.

If you buy 40 gallons a month, which is also our assumption, the extra works out to about $50.60 a month, or around $607 a year. Your own numbers will differ depending on your car, your commute and where you live.
Where gas prices differ most
Location matters more than most people expect. EIA’s weekly survey publishes prices for regions and for a handful of large states. On Oct. 19, the West Coast averaged $5.557 a gallon and California $6.031, while the Gulf Coast averaged $3.784 and Texas $3.704. Washington was at $5.332, Florida at $3.981 and Ohio at $4.049, the last up almost 18 cents in a week.
The spread between California and Texas is about $2.33 a gallon. On our 15-gallon example, that’s about $90.47 for a fill-up in California against $55.56 in Texas, a difference of about $35. For every state, see the state-by-state table on our gas prices tracker.
How crude oil feeds into gas prices
Crude is the biggest single piece of what you pay at the pump. In EIA’s breakdown of a gallon of regular in May 2026, when the retail price averaged $4.48, crude oil made up 52% of the price, refining 22%, distribution and marketing 15%, and taxes 12%. When crude moves, gas prices follow, though usually with a delay of days or weeks.
That lag is visible now. Brent spot was $135.51 on Oct. 2 and $115.22 on Oct. 20, a drop of about 15% by our math. Pump prices have fallen too, but more slowly, about 4% from the Sept. 21 peak. Crude is still far above last year: Brent spot was $60.71 on Oct. 20, 2025, so it has nearly doubled. Brent’s 2026 high in EIA’s daily data was above $138, in early April. EIA’s series is a daily spot price, which can differ from the Brent futures prices often quoted in market news.
The reasons for the high prices come down to supply. In its October Short-Term Energy Outlook, EIA said it assumes oil flows from the Middle East will stay constrained through the fourth quarter of 2026, and cited attacks on Saudi Arabia’s East-West pipeline and “extreme tightness” in diesel markets as sources of upward pressure on crude. A Bloomberg wire story carried by Rigzone on Oct. 16 also pointed to Houthi strikes on Saudi Arabia, attacks on energy infrastructure by both Russia and Ukraine, and Russian diesel being largely shut out of global markets. That story relays other reports, so we treat it as context rather than confirmed fact.
What EIA’s supply data shows
EIA’s Weekly Petroleum Status Report for the week ending Oct. 16 shows tight but not alarming gasoline supply. Commercial crude oil inventories fell 3.1 million barrels to 412.5 million, 3% below the five-year average. Gasoline inventories fell 3.0 million barrels and were 5% below the five-year average. Over the past four weeks, gasoline product supplied, EIA’s measure of demand, averaged 8.7 million barrels a day, up 1.5% from a year earlier. Refineries ran at 93.4% of capacity.
In plain terms, drivers are using a little more gasoline than last year, and stocks are somewhat below normal. That mix doesn’t point to a gasoline shortage, but it leaves less of a cushion if crude jumps again.
Diesel is the bigger squeeze
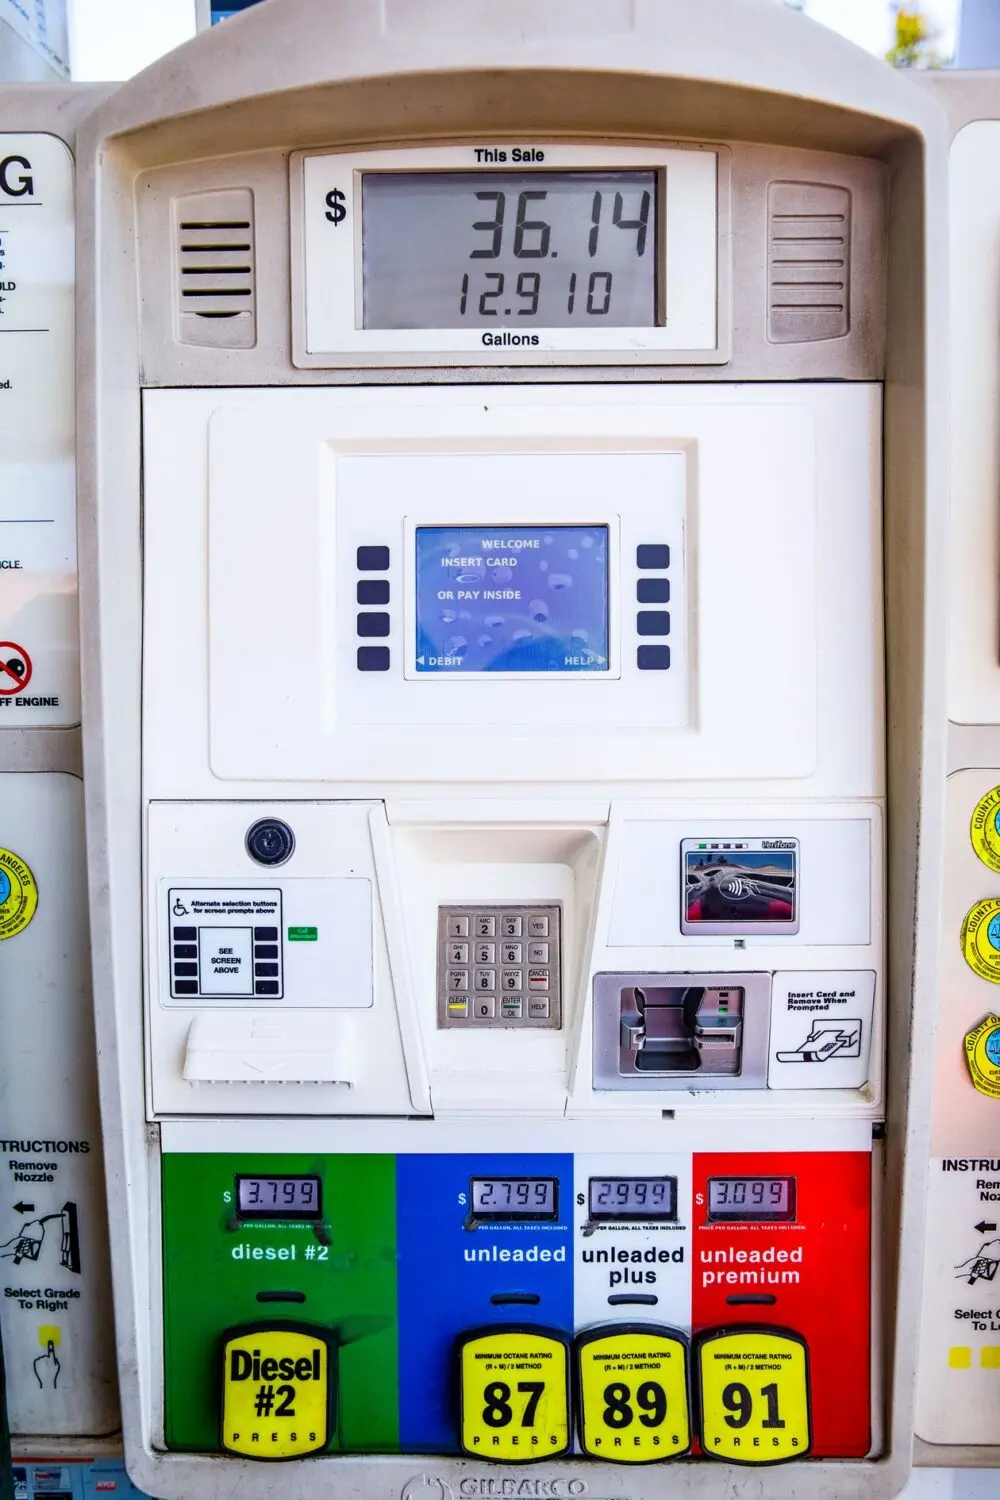
If you drive a gasoline car, diesel can feel like someone else’s problem. It isn’t, because trucks carry groceries, packages and building materials. EIA put the U.S. average for on-highway diesel at $6.276 a gallon on Oct. 19, up nearly 10 cents in a week and up from $3.620 a year earlier, about $2.66 or roughly 73% higher by our math. In California, diesel was $8.242. We can’t say how much of that reaches store shelves.

Diesel stocks are the weak spot. In the week ending Oct. 16, distillate inventories rose 1.7 million barrels but were still 9% below the five-year average, according to EIA.
What EIA expects next for gas prices
EIA’s October outlook, completed Oct. 1, forecast that Brent spot will average $105 a barrel in the fourth quarter of 2026 and fall to an average of $84 in 2027. It expects gasoline to average just under $3.60 a gallon next year and diesel about $4.50. The outlook counted 40 million barrels of crude oil exchanges from the U.S. Strategic Petroleum Reserve announced Sept. 29, but not any supply from a G7 announcement on Oct. 2.
Treat those as forecasts, not promises. EIA itself points to the potential for continued volatility in oil flows and prices. Whether Middle East supply recovers, what happens with Russian fuel exports and how cold the winter turns out are all open questions. The next EIA outlook is due Nov. 10, and the next weekly gasoline price is due Oct. 27.
Inflation is part of the picture too, and gasoline was a big part of September’s jump. We covered how the September numbers moved Fed expectations in our piece on the September inflation report and Fed hike odds, and in our look at the producer price jump.
This article is general information, not financial advice.
Editor’s take
Gas prices are easing, slowly, and that’s the story. Crude has fallen faster than the pump price, which usually means a bit more relief is still working its way through, but gas is still about 42% above last year and diesel is worse. If you drive a lot, the practical move is dull: check your state’s average on our gas prices tracker before long trips, fill up in cheaper areas when you can, and watch Brent. If it heads back toward its October high, expect gas prices to follow.
What changed
- Oct. 17, 2026: First published as “Gas Prices at $4.33: What a Tank Costs Now, Where It’s Cheapest and Why Brent Matters,” using AAA’s Oct. 15 figures.
- Oct. 22, 2026: Retitled and moved to a new address. Key numbers now come from EIA: the weekly retail gasoline and diesel prices for Oct. 19, the daily Brent spot price through Oct. 20, the Weekly Petroleum Status Report for the week ending Oct. 16, and the October Short-Term Energy Outlook. Added EIA’s forecast and a link to our weekly gas prices tracker.








5 comments